Getting Google Analytics data in R the long way
One of the ways for getting Google Analytics data in R is using the excellent package googleAnalyticsR.

GA4 and Big Query
But suppose you are curious about trying (the new) GA4 because the old one is going away, and you set it up on your site (like I did on the Discindo blog). One of the things you will notice in the GA dashboard (under Admin -> Product links), is that you can link GA with BigQuery. This integration is offered for free.
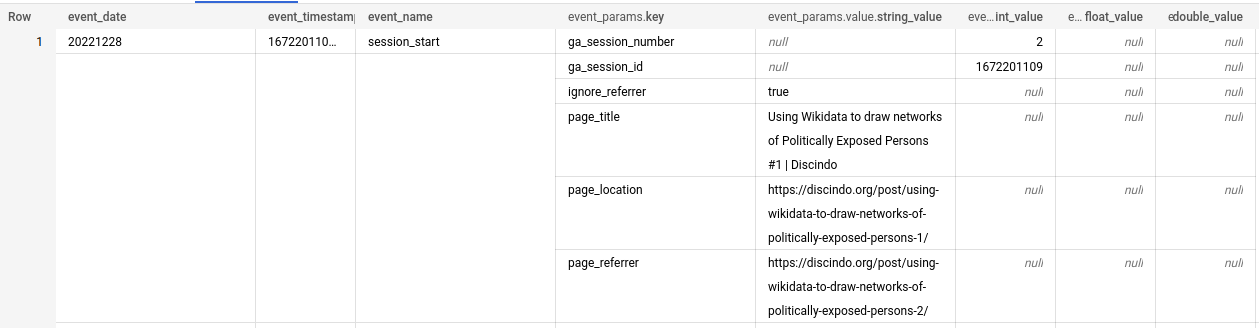
This is a rather straightforward procedure as you get to click though a bunch of screens and at the end, the connection is established. Now, if you are new to the Google Cloud Platform, you will of course need to set up an account (and receive some credits to use for testing). If not, BigQuery will suggest you set up a billing account, and you should do this together with an alert. Again, this is straightforward as GCP guides the user through the process by showing notifications and suggestions. All right. Next, the data from GA will now start to show up in your GCP project. But given that BigQuery stores table data in columnar format, the data will look like this:
At this point you can try working with the data on BigQuery (and learn some specifics about SQL dialect used there), or try to go the long way, which I did.
dbt and the ga4 package

dbt (Data Build Tool) is a nice tool for running SQL analytics code on data warehouses (such as Big Query). You can use dbt on the command line, or create an account at getdbt.com (which is free for one person). I suggest going through the tutorial to familiarize with the workflow.
In case you want to jump right in, you can create a new project, and connect to Big Query.
The cool thing about dbt is that you can install packages for additional functionality. These are published on dbthub and if you scroll down you will notice a GA4 package. This package “connects to an exported GA4 dataset and provides useful transformations as well as report-ready dimensional models that can be used to build reports” (github link). This means that by using this package the usual transformations we want can be done automatically, and the results will be flattened tables and views of GA4 data. Of course, it could be that more data models are needed than what comes by default with the package. This can be added to the dbt project as needed.
But even if you don’t use this package, or don’t use GA at all, dbt is a good tool for running analytics code because it forces good practices about collaborating on code, documenting, and testing. My experience so far is that it is superior to say writing Rmarkdown, Jupyter, or Quarto notebooks and sharing those with collaborators to develop analytics data models.
Setting up dbt to work with the GA4 package involves editing three files:
packages.ymlwhere we add the details for the GA4 package as shown on dbthub;dbt_project.ymlwhere we add details about required variables as documented on the GA4 package github;profiles.ymlwhere we add the location of the dbt dataset which has to be the same with the dataset that comes from GA.
After all is set up, we fire up dbt run and the new tables and views of transformed data will show up in Big Query in few seconds. Note: some of the transformations cannot be done without a billing account.
Getting the data in R(studio)
Now this the really simple part (for any R user at least):
library(DBI)
library(dplyr)

con <- dbConnect(
  bigrquery::bigquery(),
  project = "your_project_id",
  dataset = "your_dbt_dataset",
  billing = "your_billing acount"
)

dbListTables(con)


visited_pages_data <- tbl(con, "fct_ga4__pages") |>
  collect()
The same thing can be achieved with pandas and python. Have a look here.
Some final notes
Every part of this process probably deserves a separate blog post detailing the steps. Though, it has to be said that the linked resources are excellent, and you can set up everything by following the official documentation of each piece of the pipeline.
Additionally, this whole process may not make much sense for a simple blog like ours, but imagine that you have several data sources relevant for your business and then aggregating all analytics on Big Query can be very useful. Then, building data models in dbt with all these data can provide unified approach to analytics.
Finally, some info I learned by setting up this GA4/BigQuery/DBT/R workflow is that the most visited post on Discidno is How to invoke an AWS Lambda function with R and paws.
Novica Nakov
Data Wrangler.